Project 05Analytics & BI PipelineNYC Yellow Taxi / Q1 2019
RAW TO RELIABLE / ANALYTICS ENGINEERING / URBAN MOBILITY
NYC Yellow Taxi Analytics Engineering
An analytics engineering pipeline for NYC Yellow Taxi trip data using DuckDB, PostgreSQL, dbt, dimensional modeling, data-quality flags, and Power BI reporting.
Historical Q1 2019 trip data, explicit quality flags, two analytical grains, and recorded Power BI reporting. Local PostgreSQL infrastructure runs in Docker.
Build a consistent analytical foundation for historical trip, revenue, and operational questions.
Engineering challenge
Trip records need analytical contracts
Monthly files contain timestamps, amounts, distances, and location codes. Reporting requires a consistent period, defensible quality rules, and a clear distinction between individual trips and daily measures.
Analytical foundation
From Parquet to reporting models
DuckDB reads three remote monthly Parquet files into PostgreSQL. SQL models normalize and filter records, derive operational flags, enrich pickup and dropoff geography, and aggregate daily metrics for Power BI reporting.
Trips shown in Q1 report
22,611,788
Source period / 2019
Jan–Mar
dbt SQL model files
12
The trip count appears in both the README and recorded Power BI images. It is a report-level count, not an independently reconciled count of raw imports, filtered staging rows, unique trips, or clean analytical records. No fresh warehouse run was performed for this case study.
Separate implemented data operations, local infrastructure, and documented BI consumption.
NYC TAXI / DATA & ANALYTICS PATHS / FIG. 01●
Source-defined movement / dependency
Documented / manual relationship
Orchestration / control
Manual ingestion and staging / source-defined operations
01 / Source
TLC Parquet
January, February, March 2019
Remote reads
02 / Extraction
DuckDB
read_parquet over HTTPS
CTAS load
03 / Loading
PostgreSQL raw
Three monthly trip tables
Docker infrastructurePostgreSQL 15 service with a named data volume
Three raw sources
04 / Transformation
Q1 staging
UNION ALL, casts, pickup-date filter
Model transformations / continuation from Q1 staging
01 / Input
Q1 staging
stg_yellow_tripdata_2019_q1
Read stage
02 / Enrichment
Core trip fact
Duration, speed, validity and clean flags
Read fact
03 / Analytical outputs
Two marts
Zone-enriched trips + daily aggregates
Analytics consumption / documented connection, recorded visual output
01 / Warehouse outputs
PostgreSQL marts
Trip grain and daily grain
BI import
02 / Consumption
Power BI model
Relationships and DAX unavailable
Reports
03 / Recorded output
Operational reports
Overview, payments, geography
Solid connectors represent operations or relation reads in the committed SQL, not proof of a completed run. Repeated boundary nodes continue the flow between rows. Dashed connectors describe Power BI consumption in the README; screenshots record its outputs, while the connection and semantic model are unavailable for inspection. Docker is the PostgreSQL infrastructure annotation.
Data movement and transformations
DuckDB uses its PostgreSQL extension to create remote warehouse tables from Parquet reads. dbt SQL defines normalized staging, core business logic, and two reporting marts. Several downstream reads use hardcoded schema names rather than dbt ref dependencies.
Local infrastructure
Compose defines a PostgreSQL 15 service, an exposed database port, and a named persistent volume. Execution is manual. The published repository does not provide automated scheduling or a verified clean-checkout dbt run.
Use DuckDB as the bridge between remote Parquet files and PostgreSQL tables.
DUCKDB / ORIGINAL JANUARY LOAD / CONNECTION SETUP EXCLUDED
CREATE TABLE taxi_db.raw.yellow_tripdata_2019_01 AS
SELECT *
FROM read_parquet(
'https://d37ci6vzurychx.cloudfront.net/trip-data/yellow_tripdata_2019-01.parquet'
);
The script installs and loads the postgres extension, attaches PostgreSQL as taxi_db, and issues CREATE TABLE AS SELECT for January, February, and March 2019. Each read targets the corresponding TLC CloudFront Parquet URL. SELECT * adopts the Parquet result schema; no explicit raw column DDL is supplied.
Reruns need an operator contract
January uses CREATE TABLE; February and March use IF NOT EXISTS. A rerun can fail on January or skip an existing later table without refreshing it. There is no explicit transaction, duplicate key, incremental watermark, or failure-recovery routine. Connection placeholders and a mixed assignment fragment require adaptation before execution.
DuckDB makes remote Parquet available directly to SQL and a PostgreSQL destination. The repository contains no ingestion benchmark, throughput measurement, or independent raw-to-mart row-count reconciliation.
Twelve SQL models express distinct responsibilities across staging, core, and mart layers.
Raw / source warehouse
DuckDB creates the three trip tables with SELECT * from remote Parquet. Models also reference a zone lookup; its ingestion script is absent. Raw is a source layer, separate from dbt transformations.
yellow_tripdata_2019_01
yellow_tripdata_2019_02
yellow_tripdata_2019_03
taxi_zone_lookup
Staging / five SQL models
The Q1 view directly unions the three raw months, casts and renames fields, and applies timestamp checks. It does not depend on the standalone monthly staging files.
stg_yellow_tripdata_2019_01
stg_yellow_tripdata_2019_02
stg_yellow_tripdata_2019_03
stg_yellow_tripdata_2019_q1
stg_taxi_zone_lookup
Core / five table models
The fact derives service date, duration, speed, and two quality flags. Dimensions supply a Q1 calendar, four holiday definitions, zone attributes, and payment labels. dim_date reads dim_holiday.
fact_yellow_tripdata_2019_q1
dim_date
dim_holiday
dim_zone
dim_payment_type
Mart / two analytical grains
The trip view adds pickup and dropoff zone attributes through two left joins. The daily table groups the core fact by service_date alone and publishes counts, amounts, clean miles, clean hours, and ratios.
mart_tripdata_joined_2019_q1
mart_daily_trip_metrics
Materialization is explicit for the Q1 staging view, five core tables, trip mart view, and daily mart table. The remaining staging files omit it. Configuration needed to resolve final schemas and run order is incomplete; file existence alone does not establish an executable dbt graph.
Filter impossible period records, retain diagnostic flags, and select a defined clean population for speed.
Filtered at staging
Pickup must fall on or after January 1 and before April 1, 2019. Both timestamps must exist; dropoff must be at or after pickup. The range applies to pickup, not dropoff. UNION ALL preserves duplicates.
Retained with validity flags
Equal pickup/dropoff timestamps survive staging but fail is_valid_trip. Core also marks null or nonpositive distance, null or negative total_amount, and nonpositive duration invalid. Zero revenue is allowed. Invalid rows remain in the fact.
Selected for clean metrics
is_clean_trip requires is_valid_trip and speed BETWEEN 0.1 AND 80 mph, inclusive. Speed is null unless distance and duration are positive. Revenue validity is checked separately; a computed speed alone does not prove a valid trip.
Q1 STAGING / ACTUAL TIMESTAMP PREDICATE
where pickup_ts >= timestamp '2019-01-01'
      and pickup_ts <  timestamp '2019-04-01'
      and pickup_ts is not null
      and dropoff_ts is not null
      and dropoff_ts >= pickup_ts
Long durations are bucketed, not automatically excluded
Exploration SQL includes a 5+ hour bucket. Neither the Q1 staging filter nor the core valid/clean flags impose a five-hour maximum. A long trip can still pass if its distance, amount, timestamps, and speed satisfy those predicates.
Quality rates need a shared predicate
The daily mart counts is_clean_trip; an exploratory query counts the speed band alone. Its outlier CASE also labels unmatched values, including null speed, as “Clean.” These definitions cannot establish a common anomaly denominator. The README’s approximately 49,000 abnormalities and 99.89% clean summary are not independently reconciled.
LEFT JOIN as zpu; supplies pu_borough, pu_zone, pu_service_zone.
location_id
borough / zone / service_zone
do_location_id = location_id
dim_zone / dropoff role
LEFT JOIN as zdo; supplies do_borough, do_zone, do_service_zone.
location_id
borough / zone / service_zone
The trip mart is a wide view with prejoined geography. Lines show the two SQL left-join predicates, not validated one-to-many cardinality. No primary/foreign-key constraints, unique trip identifier, or zone uniqueness test are supplied; duplicate lookup keys could multiply rows.
One row per observed service_date. No borough, zone, or payment grouping. Carries total/valid/clean counts, revenue, clean miles, clean hours, and derived ratios. A complete Q1 calendar has 90 dates; 90 populated daily rows are documented, not independently verified.
Calendar / separate dimension
dim_date
Generates date_day and an integer YYYYMMDD date_key for January 1–March 31. The fact carries a day-truncated service_date, not that integer key. A date relationship in Power BI is documented; its actual binding is unverified.
Payment / separate dimension
dim_payment_type
Defines payment_type_id and labels for codes 0–6. The fact carries payment_type, but the trip mart does not join its label. The README describes a BI star schema; its key uniqueness, filter direction, and relationship activation require the missing PBIX.
The daily table groups only by service_date. Date and payment dimensions exist separately; no fact-to-fact join is defined in either mart.DAILY MART / ORIGINAL CLEAN SPEED & REVENUE RATIOS
        sum(trip_distance) filter (where is_clean_trip) as clean_miles_daily,
        sum(trip_duration_hours) filter (where is_clean_trip) as clean_hours_daily,
        (sum(trip_distance) filter (where is_clean_trip)) / nullif(sum(trip_duration_hours) filter (where is_clean_trip), 0) as avg_speed_mph_weighted_clean,

        -- revenue per trip
        (sum(total_amount) / nullif(count(*),0)) as avg_revenue_per_trip_daily
SUM(clean miles) / SUM(clean hours), in mph. This is the duration-weighted mean of individual trip speeds, not AVG(trip speed) and not a distance-weighted mean. The SQL comment says distance-weighted; the expression determines its meaning.
Revenue per trip / all retained records
SUM(total_amount) / COUNT(*). Revenue and trip counts include retained invalid rows; the clean flag restricts the speed metric, not the daily revenue metric. NULLIF prevents division by zero; SUM ignores null amounts while COUNT(*) includes those rows.
Rollups / preserve numerator and denominator
Across days, divide summed clean miles by summed clean hours, or summed revenue by summed trip counts. An unweighted average of daily ratios changes the weighting. A trip-to-daily fact join repeats daily totals across trips and can inflate aggregation.
Three original report images preserve the recorded analytical output, with metric definitions kept in view.
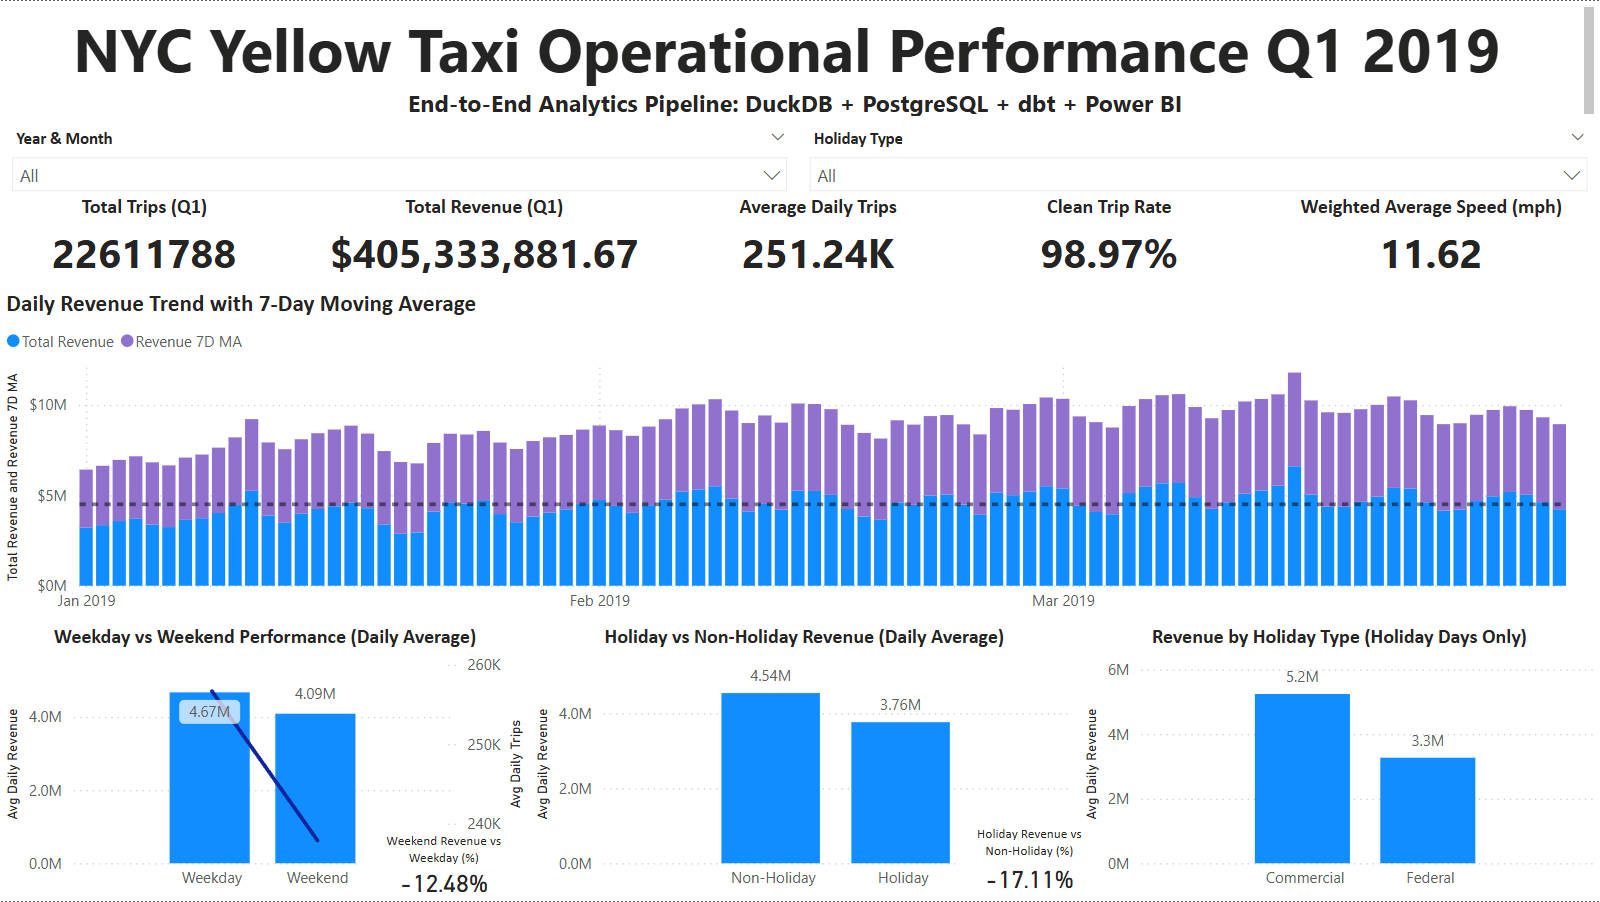
Executive overview / daily operational context
The overview records trip volume, revenue, daily trends, clean-trip rate, speed, and weekday/holiday comparisons. Daily aggregation is implemented in SQL; the screenshot’s Power BI measures and moving-average definition are unavailable.
POWER BI / RECORDED OVERVIEW
Recorded overview: daily revenue and calendar comparisons alongside report-level Q1 KPIs. The screenshot establishes the displayed values; Power BI DAX, filters, and correspondence to the published SQL are unverified.
Source: audited Taxi repository / images/dashboard_overview.jpg. Full original image, uncropped.
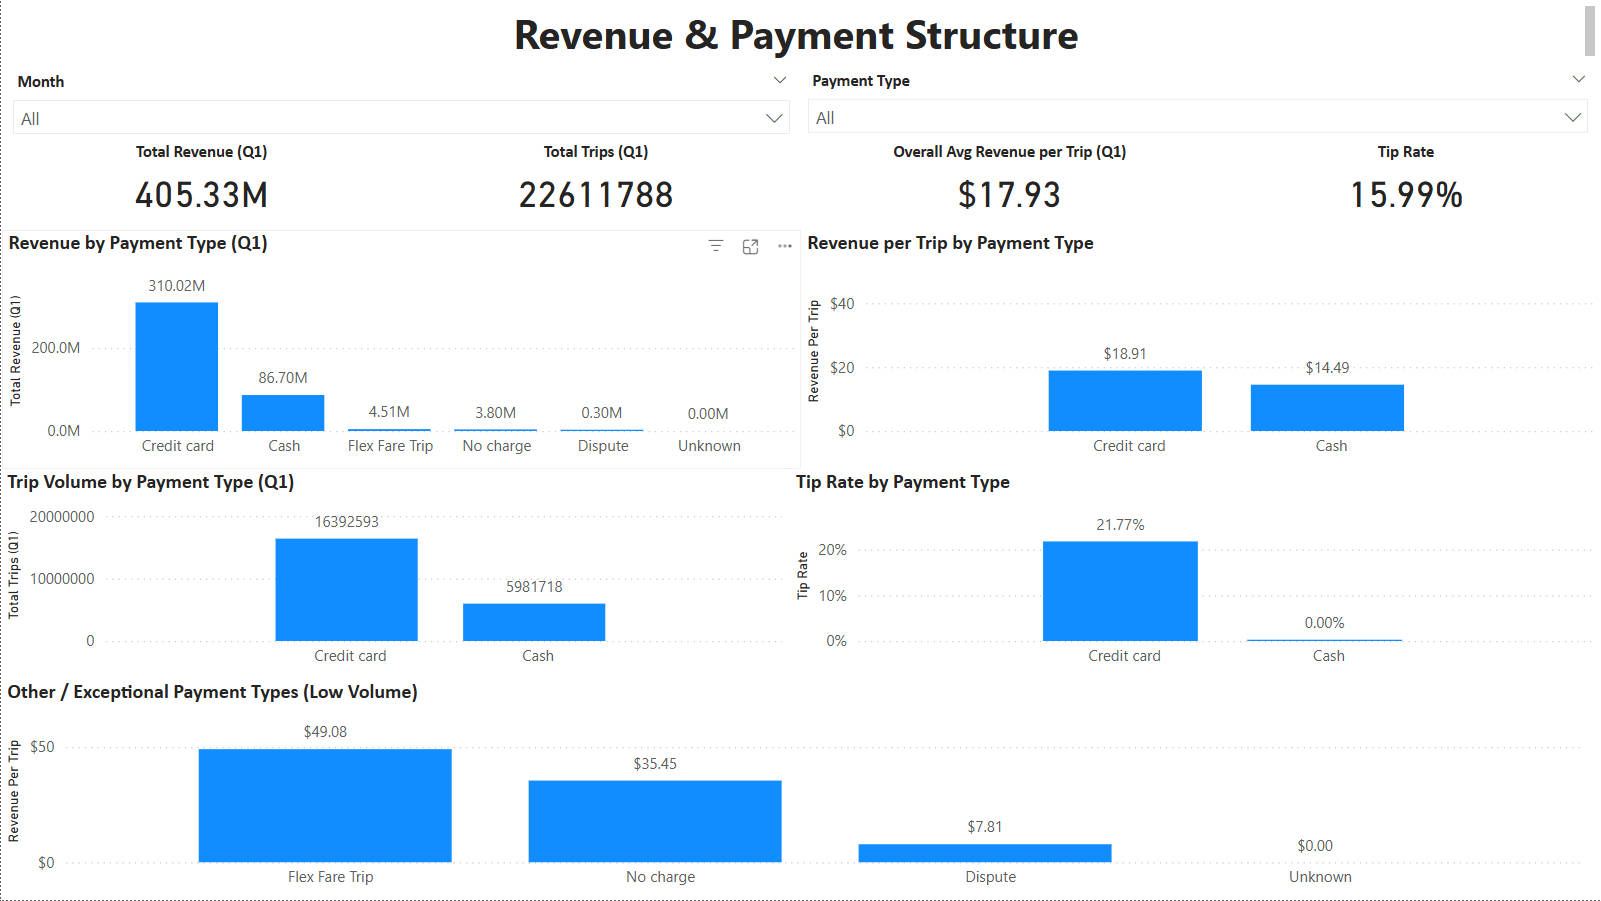
The recorded view shows 22,611,788 trips, $405,333,881.67 revenue, 98.97% clean trips, and 11.62 mph. The payment image shows $17.93 per trip. These differ from the README’s approximately $357M, $15.63, 99.89%, and 12.66 mph summaries. The images establish displayed values, not independently reproduced DAX, filters, or a reconciled execution revision.
Revenue & payment / trip-level comparisons
Payment mix, revenue per trip, and tip rate compare groups of individual records. The core retains payment_type, total_amount, and tip_amount. Payment labels exist in a separate lookup; their Power BI binding and tip-rate denominator are unavailable. TLC records electronic tips and excludes cash tips, so the displayed cash-tip zero does not prove an absence of tipping.
POWER BI / REVENUE & PAYMENT
Trip-level payment comparisons: revenue, volume, revenue per trip, and tipping measures. Metric bindings and denominators are unavailable without the PBIX; zero recorded cash tips are not evidence of no cash tipping.
Source: audited Taxi repository / images/revenue_payment_analysis.jpg. Full original image, uncropped.
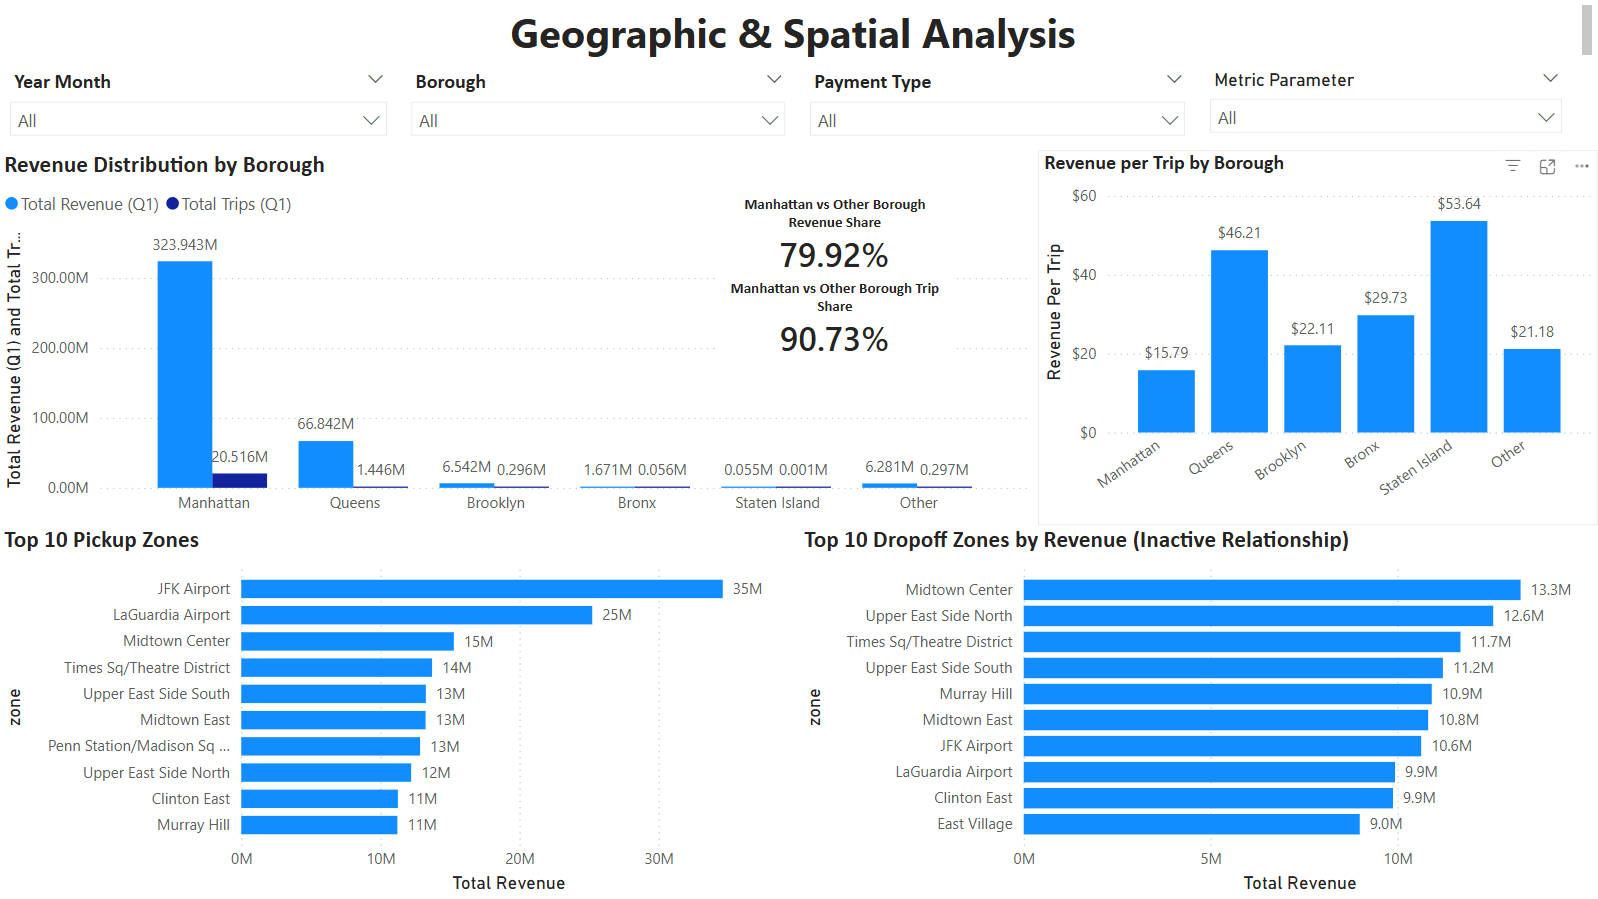
Geographic analysis / origin and destination roles
Borough and zone comparisons use trip-level detail. SQL prejoins separate pickup and dropoff attributes. The recorded chart title mentions an inactive dropoff relationship; activation logic and the exact borough measure bindings cannot be verified without the semantic model.
POWER BI / GEOGRAPHY
Origin and destination analysis at trip grain. SQL supplies distinct pickup and dropoff zone attributes. The image records an inactive-relationship label but does not expose the underlying Power BI relationship or activation measure.
Source: audited Taxi repository / images/geographic_analysis.jpg. Full original image, uncropped.
README-described duration and speed analysis. SQL includes duration buckets through 5+ hours and borough-level AVG(avg_speed_mph), a different metric from the clean distance/time ratio. No dedicated screenshot is committed.
Time & seasonality
The overview records daily trends, weekday/weekend comparisons, and holiday categories. Calendar definitions exist in SQL; the separate time-analysis report page is documented without its own image.
Congestion surcharge / descriptive comparison
The README splits January versus February–March around a February 1 cutoff. congestion_surcharge is retained in the fact; exploration SQL groups it by month and borough. The monthly query needs a trip_month column absent from the published Q1 mart. No policy screenshot or controlled causal analysis is available.
Data quality & modeling
The README describes a seventh report page. The available SQL defines validity, clean flags, and aggregate measures; its exploratory speed-only clean count is not the same predicate as the core clean flag. A dedicated report screenshot and DAX are absent.
Policy interpretation remains descriptive. The README’s February 1 boundary differs from the NYS notice requiring collection from February 2, 2019. The charge concerns trips beginning, ending, or passing through Manhattan south of and excluding 96th Street; borough-level comparisons cannot isolate that zone. No control for seasonality or other confounders is demonstrated, and no demand change is attributed causally to the policy.
Read the implementation, recorded outputs, and reproducibility limits together.
Verified in source
Three monthly Parquet loads, Q1 timestamp filtering, duration/speed logic, validity and clean flags, two geography joins, daily aggregates, dimension definitions, and a Docker PostgreSQL service. All source links are pinned to the inspected revision.
Verified by recorded output
Three original JPEG dashboard images show overview, revenue/payment, and geography views. They corroborate the displayed trip count and visual labels, while their DAX, slicer semantics, and relationship bindings remain unverified. Only these three of seven documented report pages have committed screenshots.
Configuration and query drift
The checkout has no dbt_project.yml, source YAML, automated schema/test definitions, PBIX, or execution logs. Schema setup creates staging but later refers to stg; model SQL reads hardcoded raw, raw_core, and raw_mart relations. The standalone February/March staging files still reference January, although the Q1 model bypasses them.
Limits on reproducibility
Diagnostic and exploration queries reference fields absent or differently named in the models, including pickup_datetime, trip_month, payment_type_name, full_date, and avg_speed_mph_weighted. The available queries are analytical intent, not passing test evidence. Raw/filtered/clean counts, unique trip grain, lookup cardinality, and end-to-end replay remain unverified.
Cloud warehouses, Airflow scheduling, Power BI Service publication, and additional automated tests appear as future improvements in the README. They are not implemented capabilities of this Taxi project. No streaming workload, operational deployment, measured speedup, or external business impact is claimed.
Audited source revision: 57f4145cdd271981f40e42d7311f40ff7f56e8f3. SQL excerpts preserve the original expressions and omit database connection setup. Screenshots are the original public files, uncropped. Source credentials, account details, and local paths are not reproduced.